A quick look at pg_proctab, which is now supported in Aurora and RDS PostgreSQL.
The development repository is here:
pg_proctab / pg_proctab - GitLab https://gitlab.com/pg_proctab/pg_proctab
As described by PostgreSQL extension to access the operating system process table., it provides functions to retrieve OS-related information from PostgreSQL.
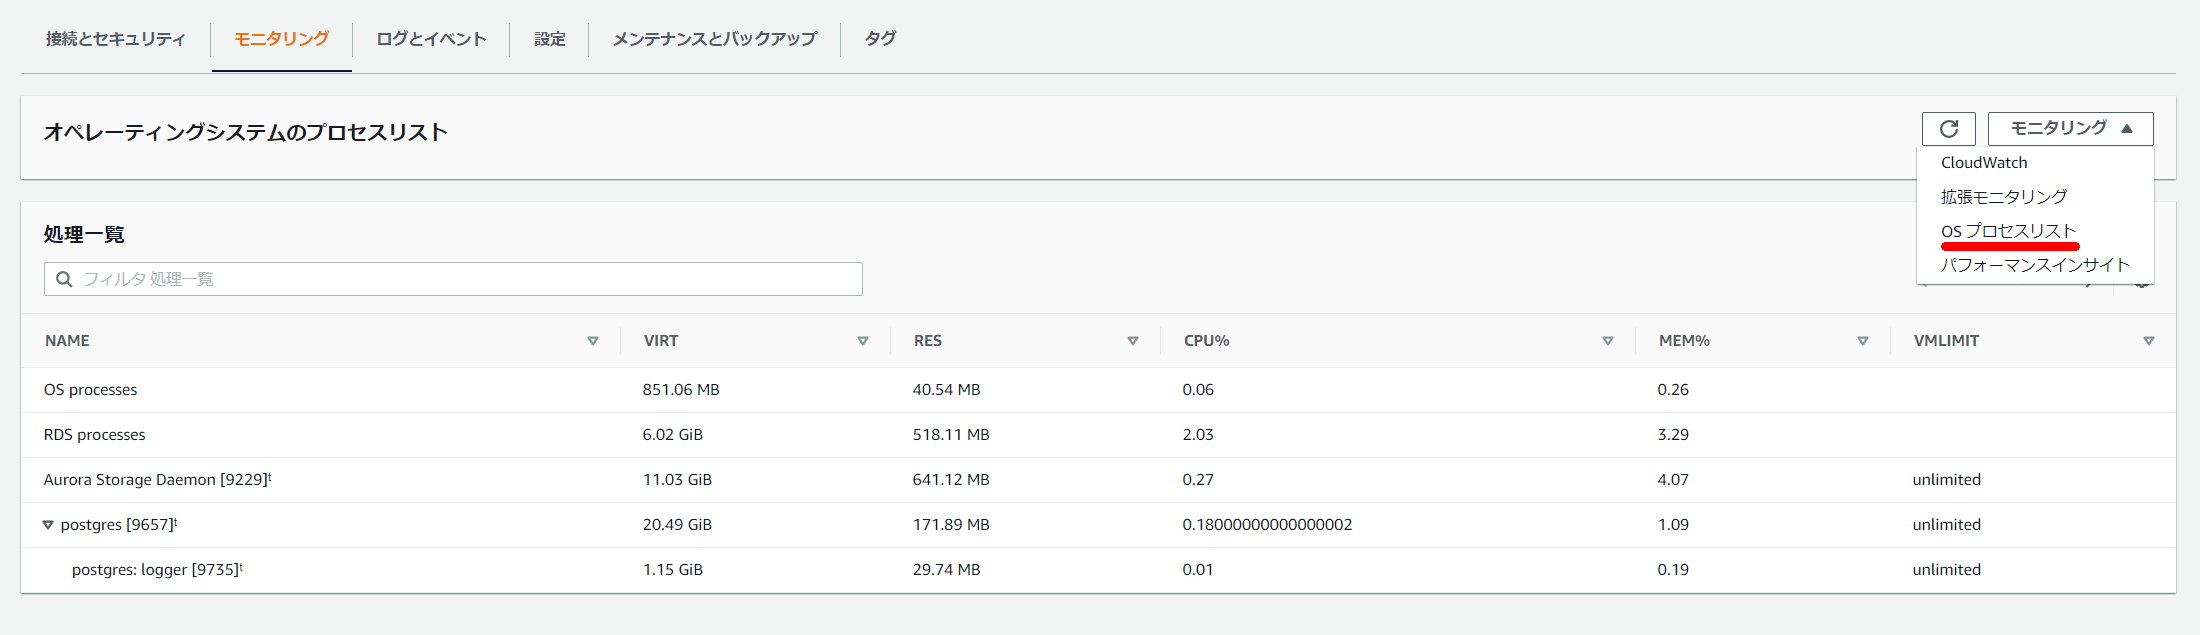
For Aurora and RDS, OS process list information was previously available only through the monitoring UI, but it can now also be accessed via SQL from PostgreSQL.
pg_proctab
create extension pg_proctab;
\dx
Added Functions
select * from pg_cputime();
select * from pg_loadavg();
select * from pg_memusage();
select * from pg_proctab();
Execution Results
postgres=> create extension pg_proctab;
CREATE EXTENSION
postgres=>
postgres=> \dx
                       List of installed extensions
    Name    | Version |   Schema   |              Description
------------+---------+------------+---------------------------------------
 pg_proctab | 0.0.9   | public     | Access operating system process table
 plpgsql    | 1.0     | pg_catalog | PL/pgSQL procedural language
(2 rows)
pg_cputime
postgres=> select * from pg_cputime();
 user  | nice | system |  idle  | iowait
-------+------+--------+--------+--------
 28387 | 5841 |  14782 | 362592 |   3942
(1 row)
user: normal processes executing in user mode
nice: niced processes executing in user mode
system: processes executing in kernel mode
idle: processes twiddling thumbs
iowait: waiting for I/O to complete
pg_loadavg
postgres=> select * from pg_loadavg();
 load1 | load5 | load15 | last_pid
-------+-------+--------+----------
 23.92 |  5.71 |   2.02 |    30030
(1 row)
load1: load average of last minute
load5: load average of last 5 minutes
load15: load average of last 15 minutes
last pid: last pid running
pg_memusage
postgres=> select * from pg_memusage();
 memused  | memfree | memshared | membuffers | memcached | swapused | swapfree | swapcached
----------+---------+-----------+------------+-----------+----------+----------+------------
 12767552 | 3357416 |         0 |      62624 |    476284 |        0 |  8384508 |          0
(1 row)
memused: Total physical RAM used
memfree: Total physical RAM not used
memshared: Not used, always 0. (For Solaris.)
membuffers: Temporary storage for raw disk blocks
memcached: In-memory cache for files read from disk
swapused: Total swap space used
swapfree: Memory evicted from RAM that is now temporary on disk
swapcached: Memory that was swapped out, now swapped in but still in swap
pg_proctab
postgres=> select * from pg_proctab();
  pid  | comm |                             fullcomm                             | state | ppid | pgrp | session | tty_nr | tpgid | flags | minflt | cminflt | majflt | cmajflt | utime | stime | cutime | cstime | priority | nice | num_threads | itrealvalue | starttime |    vsize    |  rss   | exit_signal | processor
 | rt_priority | policy | delayacct_blkio_ticks | uid | username |  rchar  | wchar | syscr | syscw | reads  | writes | cwrites
-------+------+------------------------------------------------------------------+-------+------+------+---------+--------+-------+-------+--------+---------+--------+---------+-------+-------+--------+--------+----------+------+-------------+-------------+-----------+-------------+--------+-------------+----------
-+-------------+--------+-----------------------+-----+----------+---------+-------+-------+-------+--------+--------+---------
  9811 |      | postgres: autovacuum launcher                                    | S     | 9657 |      |    9811 |      0 |    -1 |       |   4253 |       0 |      2 |       0 |    10 |    20 |      0 |      0 |       39 |   19 |           1 |           0 |     18573 | 22007947264 |  11400 |          17 |
 |           0 |      0 |                     0 |     |          | 5641788 |  3309 |  6468 |  2592 | 172032 |      0 |       0
  9813 |      | postgres: logical replication launcher                           | S     | 9657 |      |    9813 |      0 |    -1 |       |    368 |       0 |      2 |       0 |     0 |     0 |      0 |      0 |       39 |   19 |           1 |           0 |     18573 | 22003752960 |  11380 |          17 |
 |           0 |      0 |                     0 |     |          |   95979 |   726 |    37 |     9 | 454656 |      0 |       0
 15233 |      | postgres: rdsadmin rdsadmin [local] idle                         | S     | 9657 |      |   15233 |      0 |    -1 |       |    638 |       0 |      0 |       0 |    10 |     3 |      0 |      0 |       39 |   19 |           1 |           0 |     28599 | 22114021376 |  17424 |          17 |
 |           0 |      0 |                     0 |     |          |  237463 |     3 |    71 |     3 |      0 |      0 |       0
(17 rows)