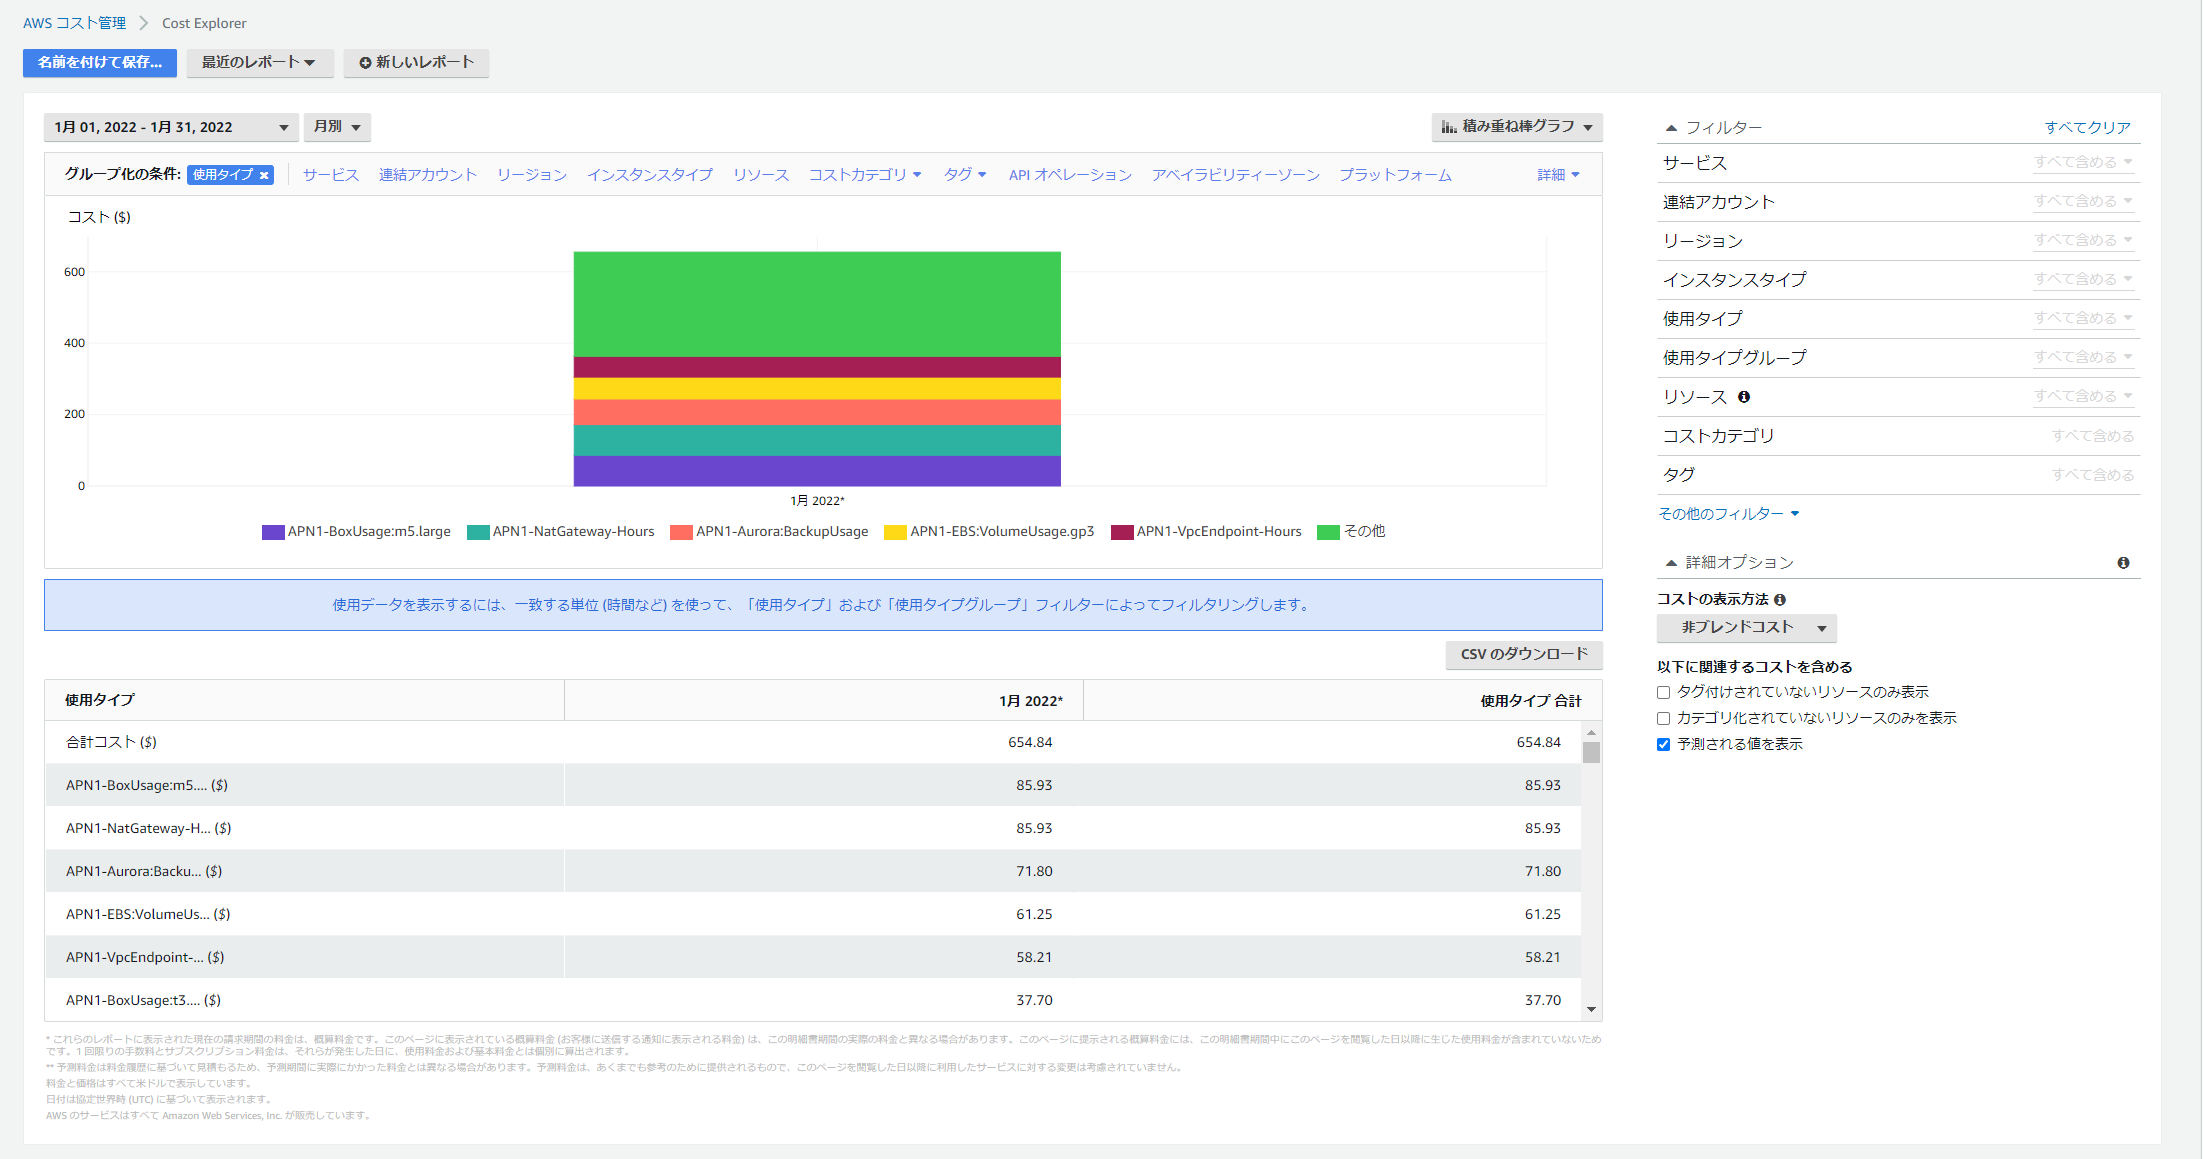
You can check the breakdown by selecting Usage Type as the group-by condition in Cost Explorer.
If you want to check quickly, run the following via AWS CLI:
aws ce get-cost-and-usage \
    --time-period Start=2022-01-01,End=2022-01-30 \
    --granularity MONTHLY  \
    --metrics UnblendedCost \
    --group-by Type=DIMENSION,Key=USAGE_TYPE | jq -r '.ResultsByTime[].Groups[] | [(.Keys[]), .Metrics.UnblendedCost.Amount] | @csv' | awk -F\" '{print $2,$3,$4}'  | sort -r -V -k 2 | head -n 20
Execution result
[ec2-user@bastin ~]$ aws ce get-cost-and-usage \
>     --time-period Start=2022-01-01,End=2022-01-30 \
>     --granularity MONTHLY  \
>     --metrics UnblendedCost \
>     --group-by Type=DIMENSION,Key=USAGE_TYPE | jq -r '.ResultsByTime[].Groups[] | [(.Keys[]), .Metrics.UnblendedCost.Amount] | @csv' | awk -F\" '{print $2,$3,$4}'  | sort -r -V -k 2 | head -n 20
APN1-NatGateway-Hours , 85.932
APN1-BoxUsage:m5.large , 85.932
APN1-Aurora:BackupUsage , 71.7980427228
APN1-EBS:VolumeUsage.gp3 , 61.2496773819
APN1-VpcEndpoint-Hours , 58.212
APN1-BoxUsage:t3.medium , 37.6992
APN1-LoadBalancerUsage , 33.6798
APN1-CW:Canary-runs , 28.0288
APN1-BoxUsage:t2.micro , 21.0672
APN1-Node:ra3.4xlarge , 18.342470776
APN1-BoxUsage:t3.large , 15.5833333696
APN1-EBS:VolumeUsage.gp2 , 14.5525795272
APN1-TimedStorage-ByteHrs , 12.0382298307
APN1-RDS:ChargedBackupUsage , 11.442173008
APN1-CW:MetricMonitorUsage , 7.2927419734
APN1-PaidEventsRecorded , 7.23436
USE1-IM-ResponsePlan-Months-Tier1 , 7
APN1-BackupUsage , 6.6523140684
ap-northeast-1-KMS-Keys , 5.580645072
APN1-PaidComplianceCheck , 5.619