First, let’s try gocmdpev.
Install go
[ec2-user@bastin ~]$ sudo yum -y install go
Loaded plugins: langpacks, priorities, update-motd
amzn2-core                                                                                                                                                                                        | 3.7 kB  00:00:00
228 packages excluded due to repository priority protections
Resolving Dependencies
--> Running transaction check
~omitted~

Installed:
  golang.x86_64 0:1.15.14-1.amzn2.0.1

Dependency Installed:
  apr.x86_64 0:1.6.3-5.amzn2.0.2        apr-util.x86_64 0:1.6.1-5.amzn2.0.2     apr-util-bdb.x86_64 0:1.6.1-5.amzn2.0.2     golang-bin.x86_64 0:1.15.14-1.amzn2.0.1     golang-src.noarch 0:1.15.14-1.amzn2.0.1
  mercurial.x86_64 0:2.6.2-10.amzn2     neon.x86_64 0:0.30.0-3.amzn2.0.2        pakchois.x86_64 0:0.4-10.amzn2.0.2          subversion.x86_64 0:1.7.14-16.amzn2.0.1     subversion-libs.x86_64 0:1.7.14-16.amzn2.0.1

Complete!
[ec2-user@bastin ~]$
[ec2-user@bastin ~]$ go version
go version go1.15.14 linux/amd64
[ec2-user@bastin ~]$ go get -u github.com/simon-engledew/gocmdpev
[ec2-user@bastin ~]$ echo $?
0
[ec2-user@bastin ~]$ ./go/bin/gocmdpev --version
1.0.0
Generating test data for visualization
pgbench -i -s 100 -U postgres -h xxxx.cluster-xxxx.ap-northeast-1.rds.amazonaws.com pgbench
Test SQL
EXPLAIN (ANALYZE, COSTS, VERBOSE, BUFFERS, FORMAT JSON) SELECT t1.aid,t1.bid,t1.abalance,t2.bbalance FROM pgbench_accounts t1, pgbench_branches t2 where t1.bid=t2.bid ORDER BY t1.abalance DESC;
This SQL involves sorting and joins, which may be problematic.
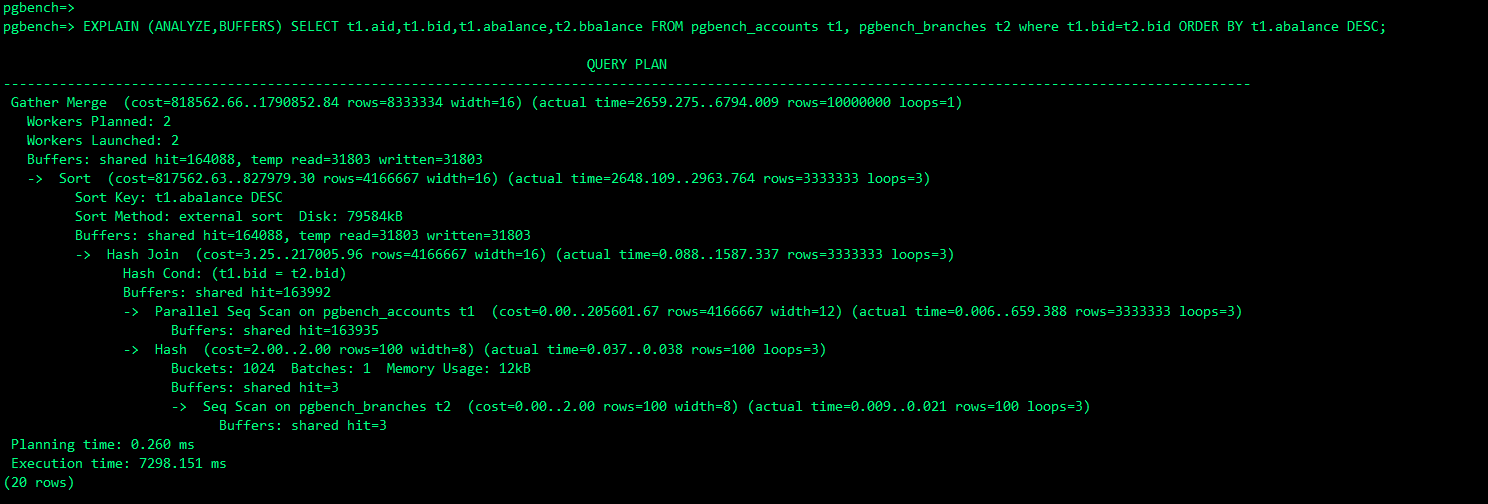
Generate an execution plan for passing to gocmdpev with FORMAT specification.
vi explain.sql
Write the following SQL to explain.sql. Specify ANALYZE, COSTS, VERBOSE, BUFFERS, FORMAT JSON as EXPLAIN options.
EXPLAIN (ANALYZE, COSTS, VERBOSE, BUFFERS, FORMAT JSON) SELECT t1.aid,t1.bid,t1.abalance,t2.bbalance FROM pgbench_accounts t1, pgbench_branches t2 where t1.bid=t2.bid ORDER BY t1.abalance DESC;
Execute the SQL and output the execution plan to analyze.json.
psql -h auroraserverlessv1.cluster-cm678nkt5thr.ap-northeast-1.rds.amazonaws.com -U postgres -d pgbench -qAt -f explain.sql > analyze.json
Pass the output analyze.json to gocmdpev.
cat analyze.json | gocmdpev
The output below shows where time is being spent with color coding, making analysis easier.
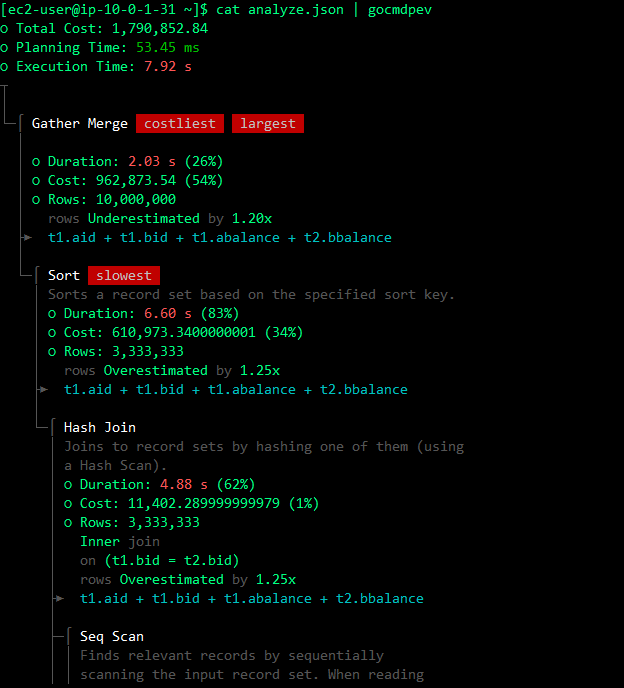
[ec2-user@bastin ~]$ cat analyze.json | gocmdpev
○ Total Cost: 1,790,852.84
○ Planning Time: 53.45 ms
○ Execution Time: 7.92 s
┬
│
└─⌠ Gather Merge  costliest   largest
  │
  │ ○ Duration: 2.03 s (26%)
  │ ○ Cost: 962,873.54 (54%)
  │ ○ Rows: 10,000,000
  │   rows Underestimated by 1.20x
  ├►  t1.aid + t1.bid + t1.abalance + t2.bbalance
  │
  └─⌠ Sort  slowest
    │ Sorts a record set based on the specified sort key.
    │ ○ Duration: 6.60 s (83%)
    │ ○ Cost: 610,973.3400000001 (34%)
    │ ○ Rows: 3,333,333
    │   rows Overestimated by 1.25x
    ├►  t1.aid + t1.bid + t1.abalance + t2.bbalance
    │
    └─⌠ Hash Join
      │ Joins to record sets by hashing one of them (using
      │ a Hash Scan).
      │ ○ Duration: 4.88 s (62%)
      │ ○ Cost: 11,402.289999999979 (1%)
      │ ○ Rows: 3,333,333
      │   Inner join
      │   on (t1.bid = t2.bid)
      │   rows Overestimated by 1.25x
      ├►  t1.aid + t1.bid + t1.abalance + t2.bbalance
      │
      ├─⌠ Seq Scan
      │ │ Finds relevant records by sequentially
      │ │ scanning the input record set. When reading
      │ │ from a table, Seq Scans (unlike Index Scans)
      │ │ perform a single read operation (only the
      │ │ table is read).
      │ │ ○ Duration: 5.12 s (65%)
      │ │ ○ Cost: 205,601.67 (11%)
      │ │ ○ Rows: 3,333,333
      │ │   on public.pgbench_accounts
      │ │   rows Overestimated by 1.25x
      │ ⌡► t1.aid + t1.bid + t1.abalance
      │
      └─⌠ Hash
        │ Generates a hash table from the records in the
        │ input recordset. Hash is used by Hash Join.
        │ ○ Duration: <1 ms (0%)
        │ ○ Cost: 0 (0%)
        │ ○ Rows: 100
        ├►  t2.bbalance + t2.bid
        │
        └─⌠ Seq Scan
          │ Finds relevant records by sequentially
          │ scanning the input record set. When reading
          │ from a table, Seq Scans (unlike Index Scans)
          │ perform a single read operation (only the
          │ table is read).
          │ ○ Duration: <1 ms (0%)
          │ ○ Cost: 2 (0%)
          │ ○ Rows: 100
          │   on public.pgbench_branches
          ⌡► t2.bbalance + t2.bid
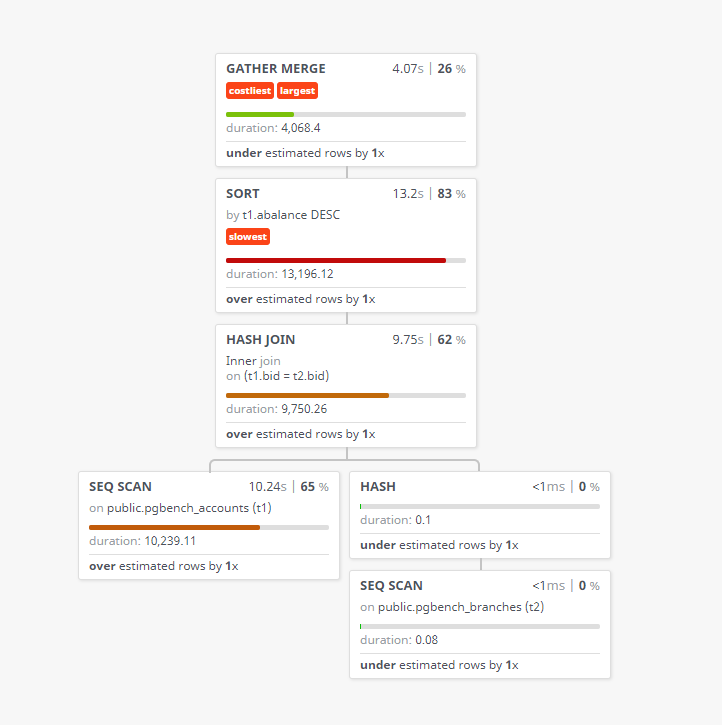
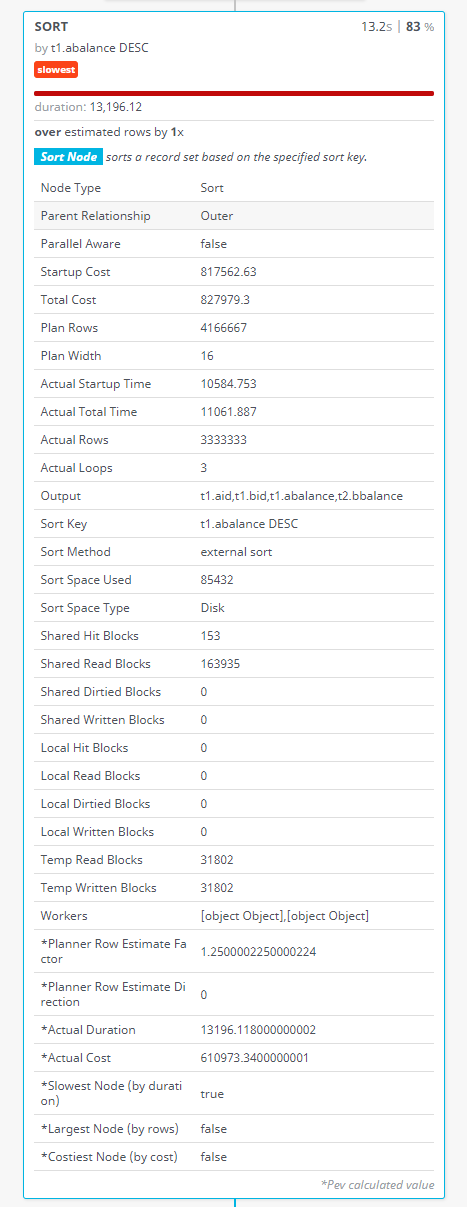
There is also a visualization tool called pev. It may be more intuitive and easier to read. You can choose between CLI-based gocmdpev and GUI-based pev. Like gocmdpev, pev can visualize execution plans by loading ANALYZE, COSTS, VERBOSE, BUFFERS, FORMAT JSON output.
As stated below, plans are processed locally, but it may be wise to be cautious:
DISCLAIMER: Pev stores your plans locally (localStorage) and will not send them anywhere.
Make PostgreSQL EXPLAIN easier to read with pev and gocmdpev | gocmdpev https://wonderwall.hatenablog.com/entry/2017/09/13/220000