Introduction
DB-Engines is a service that measures and publishes the popularity of database management systems on a monthly basis, tracking scores continuously since November 2012. Scores are calculated by normalizing and aggregating search engine hit counts from Google and Bing, Google Trends data, Stack Overflow mentions, LinkedIn profile counts, job postings on Indeed and Simply Hired, and Twitter mentions. It does not directly measure actual installations or usage — instead, the index reflects “how much a database is being talked about.”
In this article, I use data as of March 2026 to review the long-term trends of the top 50 databases and identify those that are rising or falling most rapidly.
Methodology
I scraped the JavaScript data embedded in the DB-Engines trend page (/en/ranking_trend) using Python and visualized it with matplotlib. The data is recorded monthly from November 2012 to March 2026, covering 487 database systems.
The analysis scope was narrowed using the following criteria:
| Criteria | Details |
|---|---|
| Top 50 trends | Top 50 databases by score as of March 2026 |
| Momentum analysis | Score ≥ 3.0, with 1-year and 3-year rate of change calculated |
| Exclusions | Minor databases with scores below 3.0 were excluded due to high noise |
The scripts are available here:
dbengines_top50_trend.py— Generates the top 50 trend chartdbengines_momentum.py— Generates the momentum analysis charts
Top 50 Score Trends
The top 50 as of March 2026 are as follows:
| Rank | Database | Score |
|---|---|---|
| 1 | Oracle | 1182.46 |
| 2 | MySQL | 858.34 |
| 3 | Microsoft SQL Server | 711.47 |
| 4 | PostgreSQL | 680.08 |
| 5 | MongoDB | 383.58 |
| 6 | Snowflake | 211.24 |
| 7 | Databricks | 145.81 |
| 8 | Redis | 145.19 |
| 9 | IBM Db2 | 111.38 |
| 10 | Elasticsearch | 103.58 |
| 11 | Apache Cassandra | 101.88 |
| 12 | SQLite | 95.97 |
| 13 | MariaDB | 87.00 |
| 14 | Microsoft Azure SQL Database | 73.92 |
| 15 | Apache Hive | 72.95 |
| 16 | Splunk | 72.21 |
| 17 | Microsoft Access | 67.56 |
| 18 | Amazon DynamoDB | 65.42 |
| 19 | Google BigQuery | 55.82 |
| 20 | Neo4j | 47.32 |
| 21 | Apache Solr | 32.79 |
| 22 | SAP HANA | 32.09 |
| 23 | Teradata | 31.08 |
| 24 | FileMaker | 29.31 |
| 25 | SAP Adaptive Server | 25.53 |
| 26 | Microsoft Azure Cosmos DB | 22.75 |
| 27 | Apache Spark (SQL) | 22.07 |
| 28 | ClickHouse | 22.01 |
| 29 | PostGIS | 21.88 |
| 30 | InfluxDB | 20.73 |
| 31 | OpenSearch | 20.27 |
| 32 | Apache HBase | 19.18 |
| 33 | Firebird | 17.44 |
| 34 | Microsoft Azure Synapse Analytics | 15.98 |
| 35 | Microsoft Fabric | 15.12 |
| 36 | Firebase Realtime Database | 15.11 |
| 37 | Amazon Redshift | 14.25 |
| 38 | Informix | 13.78 |
| 39 | Memcached | 13.68 |
| 40 | Apache Impala | 12.67 |
| 41 | Apache Flink | 10.25 |
| 42 | Couchbase | 10.15 |
| 43 | DuckDB | 9.41 |
| 44 | Google Cloud Firestore | 9.29 |
| 45 | Amazon Aurora | 9.16 |
| 46 | Endeca | 9.08 |
| 47 | Prometheus | 8.71 |
| 48 | Vertica | 8.39 |
| 49 | Pinecone | 7.74 |
| 50 | H2 | 7.56 |
The chart below shows the long-term score trends for Rank 1–25 (top) and Rank 26–50 (bottom).
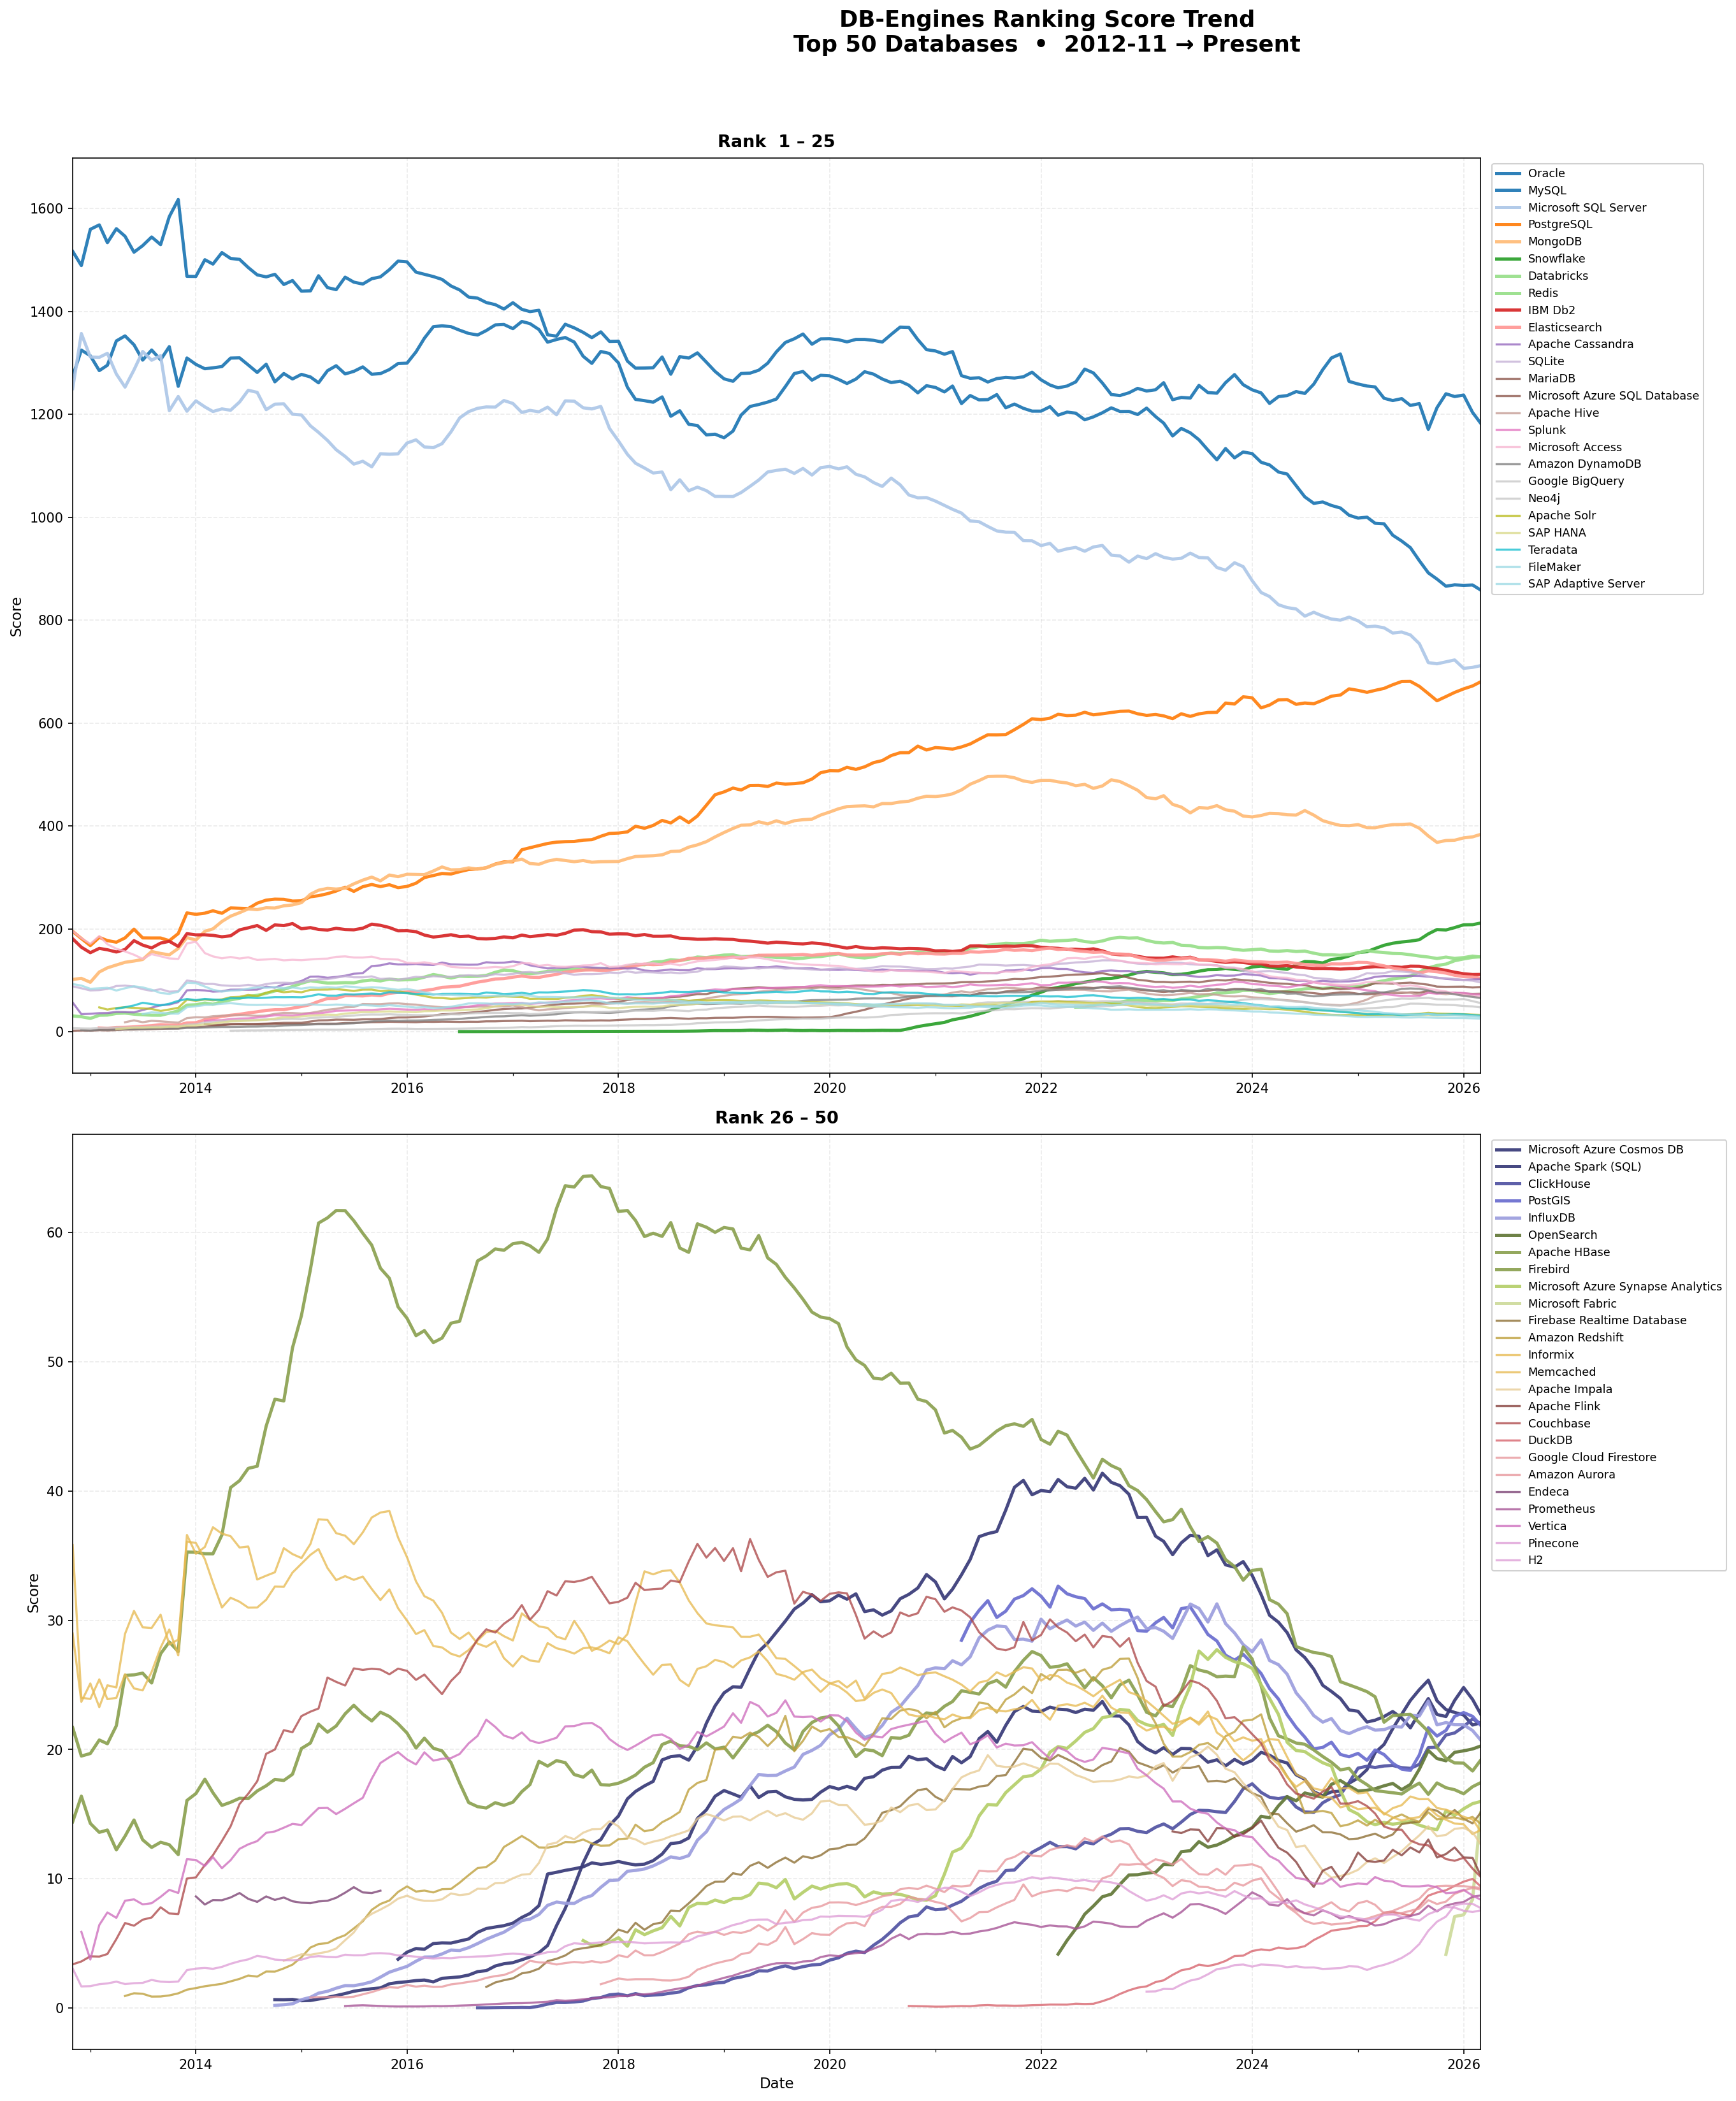 DB-Engines — Top 50 Score Trends (November 2012 – March 2026)
Here is a summary of the major shifts observable from the long-term trends:
| Database | Trend | Notes |
|---|---|---|
| Oracle | Gradual decline | Long-term decrease from a peak around 2013, but still #1 |
| MySQL | Gradual decline | Maintains #2 but absolute score is shrinking |
| PostgreSQL | Gradual rise | Steadily closing the gap with MySQL |
| Snowflake | Rapid growth | Appeared on DB-Engines in 2016; surged around its 2020 IPO to reach #6 |
| Databricks | Rapid growth | Sharp rise since 2020; now #7 |
| MongoDB | Stable | The only NoSQL database maintaining a top 5 position |
Fastest-Rising Databases
I calculated 1-year and 3-year rates of change for all databases with a score of 3.0 or above.
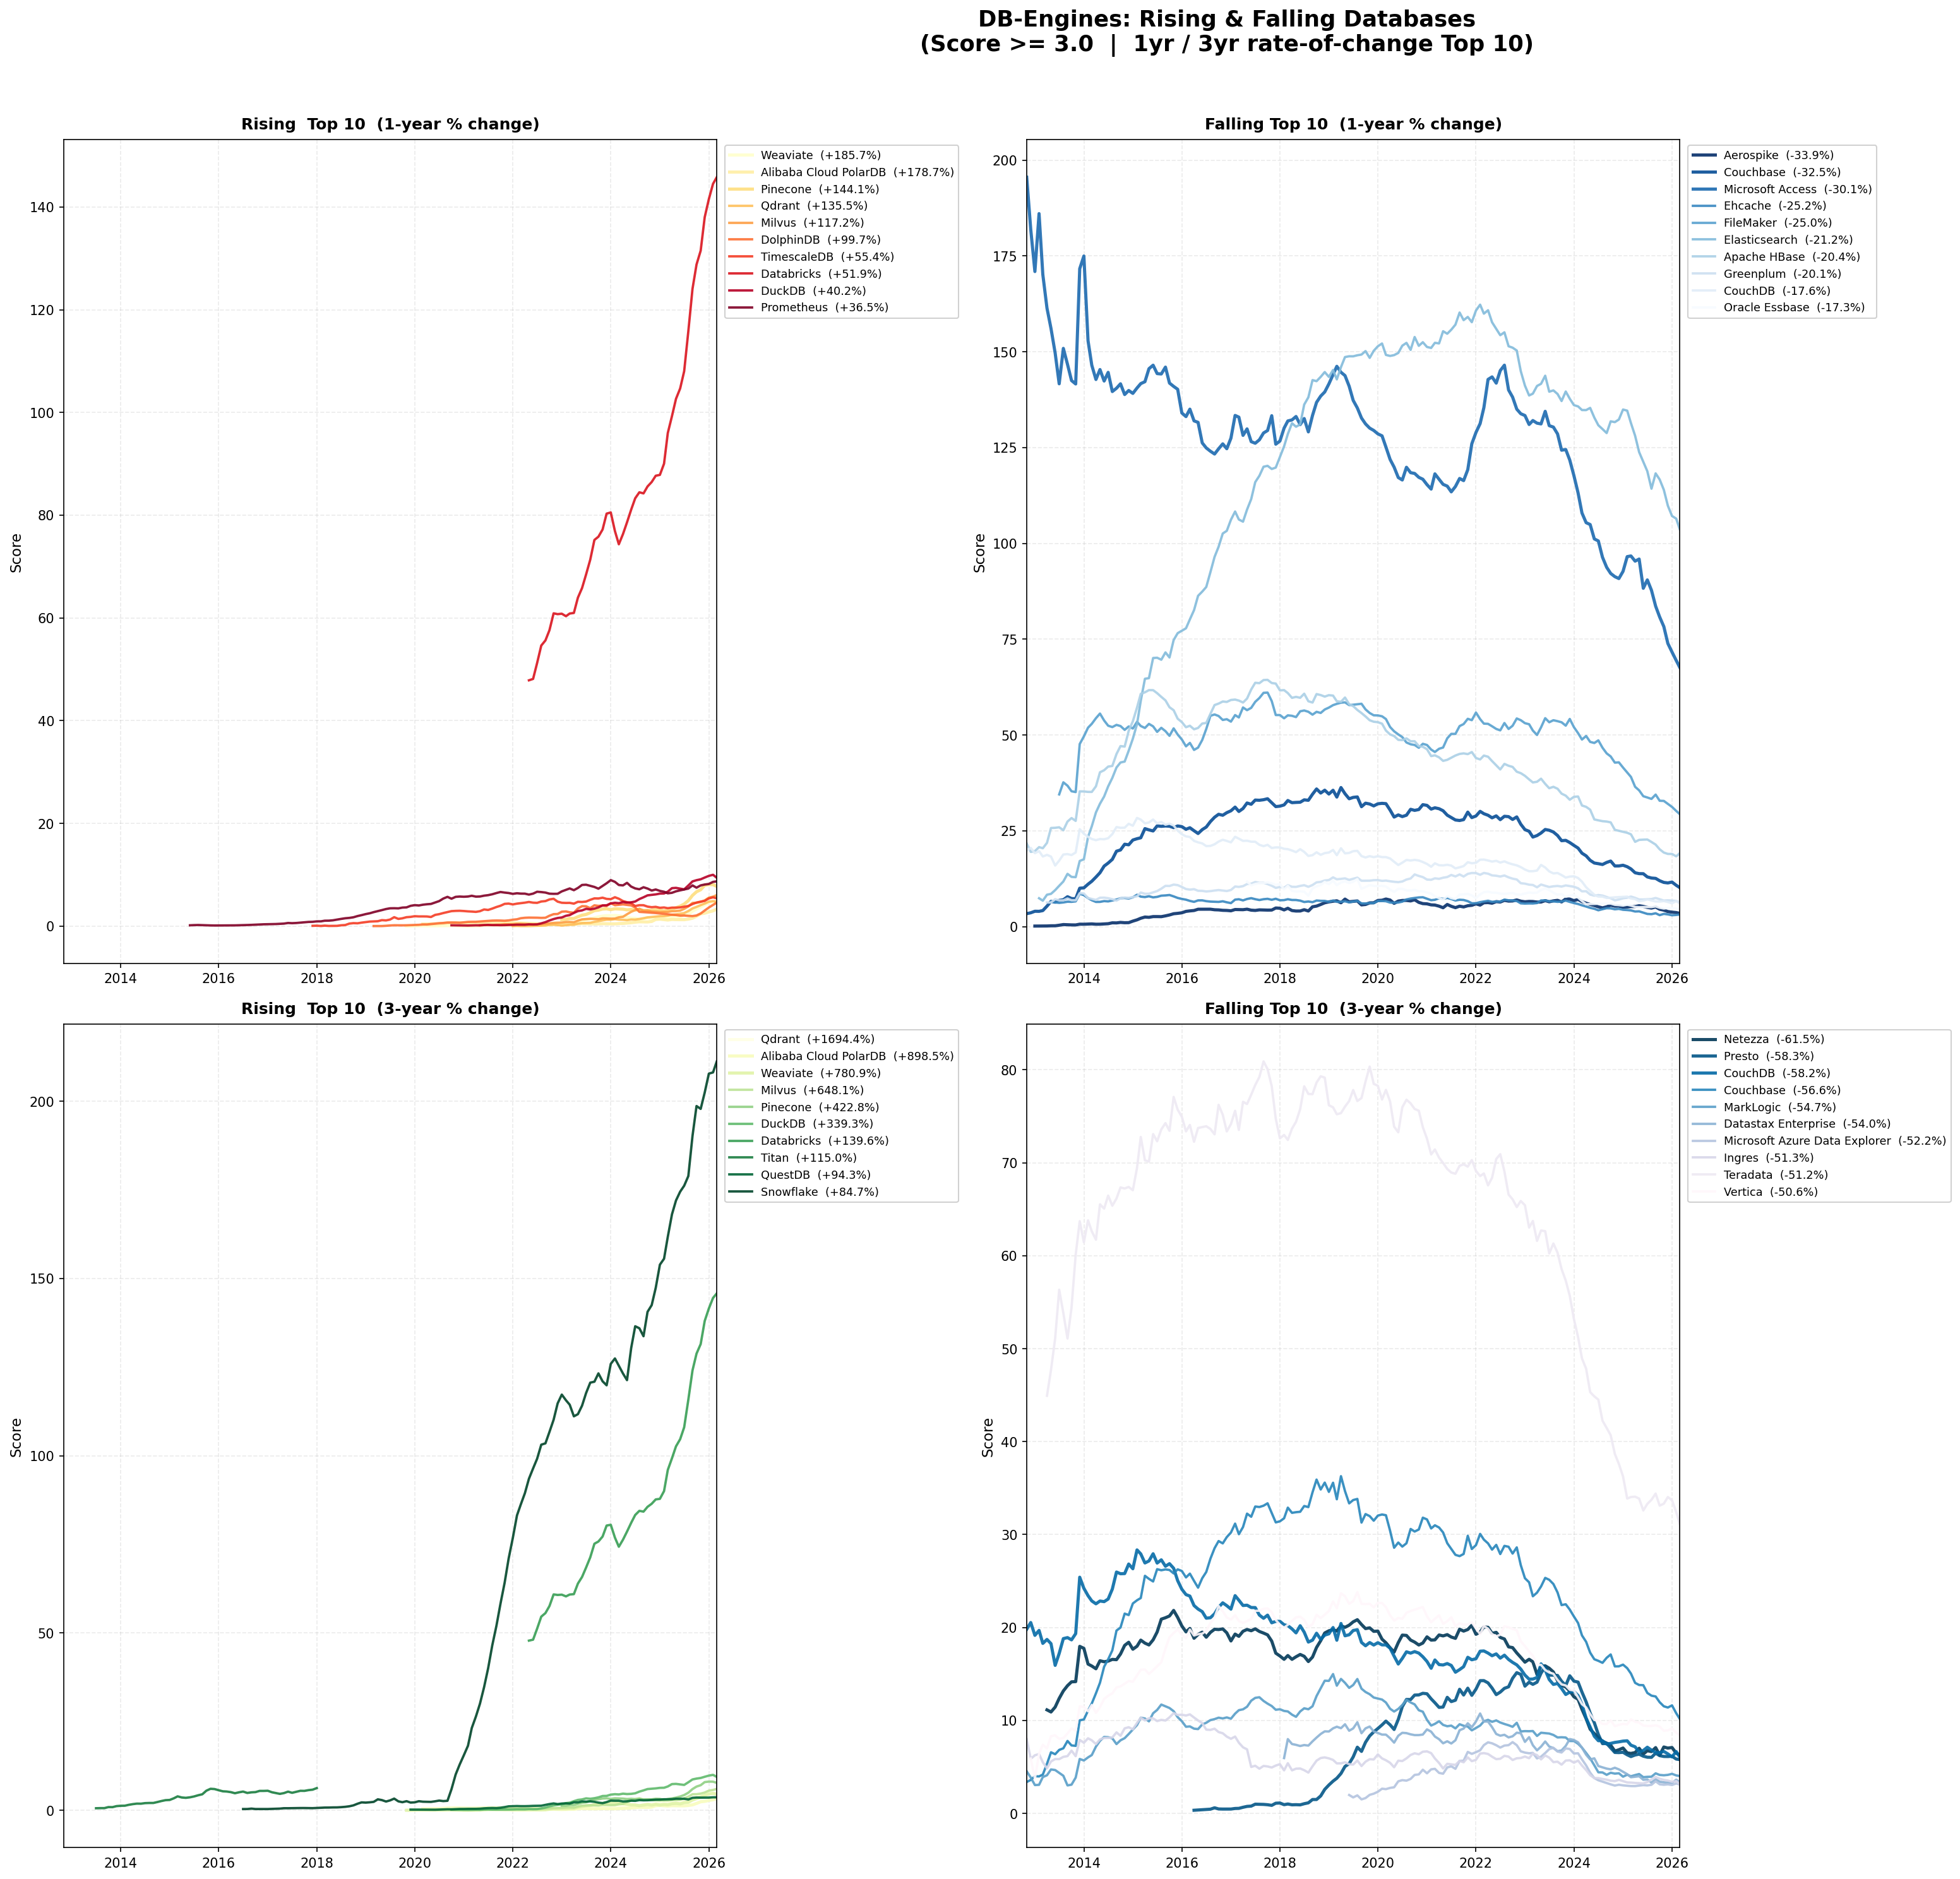 DB-Engines — Fastest-Rising and Fastest-Falling Rankings (Score ≥ 3.0, Top 10 by 1-Year and 3-Year Rate of Change)
Last 1 Year (March 2025 → March 2026)
| Rank | Database | Category | Current Score | 1 Year Ago | Change |
|---|---|---|---|---|---|
| 1 | Weaviate | Vector DB | 4.52 | 1.58 | +186% |
| 2 | Alibaba Cloud PolarDB | Cloud RDB | 3.31 | 1.19 | +179% |
| 3 | Pinecone | Vector DB | 7.74 | 3.17 | +144% |
| 4 | Qdrant | Vector DB | 4.79 | 2.03 | +136% |
| 5 | Milvus | Vector DB | 6.02 | 2.77 | +117% |
| 6 | DolphinDB | Time-Series DB | 4.58 | 2.29 | +100% |
| 7 | TimescaleDB | Time-Series DB | 5.42 | 3.48 | +55% |
| 8 | Databricks | Cloud DWH | 145.81 | 96.01 | +52% |
| 9 | DuckDB | Embedded Analytics DB | 9.41 | 6.71 | +40% |
| 10 | Prometheus | Time-Series DB | 8.71 | 6.38 | +37% |
The top spots in the 1-year rate of change are dominated by vector databases (Weaviate, Pinecone, Qdrant, Milvus). All of them are seeing increased adoption as the foundation for RAG (Retrieval-Augmented Generation) and semantic search, directly absorbing demand from the generative AI boom.
DuckDB continues its steady growth at +40%. As an in-process analytics engine, it is gaining traction as a way to reduce Snowflake costs and as a local analytics platform.
Last 3 Years (March 2023 → March 2026)
| Rank | Database | Category | Current Score | 3 Years Ago | Change |
|---|---|---|---|---|---|
| 1 | Qdrant | Vector DB | 4.79 | 0.27 | +1694% |
| 2 | Weaviate | Vector DB | 4.52 | 0.51 | +781% |
| 3 | Milvus | Vector DB | 6.02 | 0.81 | +648% |
| 4 | Pinecone | Vector DB | 7.74 | 1.48 | +423% |
| 5 | DuckDB | Embedded Analytics DB | 9.41 | 2.14 | +339% |
| 6 | Databricks | Cloud DWH | 145.81 | 60.86 | +140% |
| 7 | QuestDB | Time-Series DB | 3.66 | 1.89 | +94% |
| 8 | Snowflake | Cloud DWH | 211.24 | 114.40 | +85% |
Over a 3-year span, the rise of the “big four” vector databases becomes even more pronounced. Qdrant went from a score of 0.27 to 4.79 — roughly a 17x increase. DuckDB also grew 4.4x over three years, tracing a curve clearly different from its pre-2023 trajectory.
Fastest-Falling Databases
Last 1 Year (March 2025 → March 2026)
| Rank | Database | Category | Current Score | 1 Year Ago | Change |
|---|---|---|---|---|---|
| 1 | Aerospike | NoSQL (Key-Value) | 3.45 | 5.22 | -34% |
| 2 | Couchbase | NoSQL (Document) | 10.15 | 15.05 | -33% |
| 3 | Microsoft Access | Desktop RDB | 67.56 | 96.72 | -30% |
| 4 | FileMaker | Desktop RDB | 29.31 | 39.06 | -25% |
| 5 | Ehcache | In-Memory Cache | 3.16 | 4.22 | -25% |
| 6 | Elasticsearch | Search Engine | 103.58 | 131.38 | -21% |
| 7 | Apache HBase | NoSQL (Wide Column) | 19.18 | 24.08 | -20% |
| 8 | Greenplum | MPP Analytics DB | 6.26 | 7.83 | -20% |
| 9 | CouchDB | NoSQL (Document) | 6.05 | 7.34 | -17% |
| 10 | Oracle Essbase | OLAP/Multidimensional DB | 4.54 | 5.49 | -17% |
Elasticsearch dropped significantly at -21%. This is likely due to full-text search use cases fragmenting across OpenSearch (a fork of Elasticsearch) and various cloud-managed services. The decline of legacy desktop databases like Microsoft Access (-30%) and FileMaker (-25%) also continues.
Last 3 Years (March 2023 → March 2026)
| Rank | Database | Category | Current Score | 3 Years Ago | Change |
|---|---|---|---|---|---|
| 1 | Netezza | On-Premises DWH | 6.28 | 16.31 | -62% |
| 2 | Presto | Distributed Query Engine | 5.79 | 13.89 | -58% |
| 3 | CouchDB | NoSQL (Document) | 6.05 | 14.46 | -58% |
| 4 | Couchbase | NoSQL (Document) | 10.15 | 23.36 | -57% |
| 5 | MarkLogic | NoSQL (Document/XML) | 4.02 | 8.87 | -55% |
| 6 | DataStax Enterprise | NoSQL (Wide Column) | 3.37 | 7.33 | -54% |
| 7 | Teradata | On-Premises DWH | 31.08 | 63.74 | -51% |
| 8 | Vertica | On-Premises Analytics DB | 8.39 | 16.98 | -51% |
Over the 3-year span, on-premises DWHs and distributed query engines closely tied to the Hadoop ecosystem show the steepest declines. All of them have lost competitiveness due to their on-premises-centric architectures, and the shift to cloud-native designs is clearly underway.
Discussion
Three key trends emerge from the data:
1. Generative AI is directly driving demand for vector databases
All four — Qdrant, Weaviate, Milvus, and Pinecone — have seen sharp score increases since around 2023, coinciding with the expansion of RAG architecture adoption following the launch of ChatGPT. These databases are not replacing RDBMSs or general-purpose NoSQL systems; rather, they are creating their own category of demand as infrastructure for LLM applications.
2. DuckDB is gaining attention as a cloud DWH alternative
DuckDB’s 3-year growth of +339% reflects increasing adoption as a cost-saving alternative to cloud DWHs for analytics workloads. Since it runs in-process, no infrastructure is required, and it delivers sufficient performance for small to mid-sized analytical workloads.
3. The exit of legacy DWHs and the Hadoop ecosystem is accelerating
On-premises DWHs and distributed query engines have all declined by more than 50% over three years. Systems built on on-premises architectures or closely tied to the Hadoop ecosystem have lost competitiveness against cloud-native designs. The rapid waning of engineer interest is clearly reflected in DB-Engines scores.
Summary
- Top 50 long-term trends: Oracle, MySQL, and SQL Server are gradually declining; PostgreSQL is slowly rising; Snowflake and Databricks are growing rapidly
- Fastest rising (1 year): The big four vector databases (Weaviate, Pinecone, Qdrant, Milvus) at +100% to +186% — a direct hit from the AI boom
- Fastest rising (3 years): Qdrant at +1694%, DuckDB at +339% — becoming established as structural shifts
- Fastest falling: Legacy DWHs (Teradata, Netezza) down over 50% in 3 years; first-generation NoSQL (Couchbase, CouchDB) also in decline