Introduction
Summarizing what I studied for ‘AWS Certified Machine Learning – Specialty’. Mainly terminology notes for machine learning. Just rough notes.
Terminology Notes
- Explanatory variable (Feature)
- The cause in a causal relationship, the input to a function. In y=f(x), x is the explanatory variable.
- Target variable (Label)
- The result in a causal relationship, the output of a function. In y=f(x), y is the target variable.
- Linear Regression
- Given a variable x, explain or predict the value of y that has a correlation with it.
-
Logistic Regression
-
The shape of the logistic function is as follows. Takes values from 0 to 1 and monotonically increases.
-
-
Activation Function
- Many activation functions exist. The purpose is to convert an input value to another value for output.
-
Sigmoid Function
- Takes values between 0 and 1. Often used for binary classification. Becomes smoother as it approaches 0 or 1.
-
Overfitting
- A state where the model fits the given data (including noise) too closely, resulting in low error on training data but poor performance on unseen data.
-
Generalization Ability
- Performance on unseen data (generalization ability). It’s important to minimize the quantified generalization error.
-
Normalization
- Transforming feature values to a certain range. Mainly [0, 1] or [-1, 1].
-
Regularization
- Prevents overfitting.
- Does not target data that seems extreme.
- L1 regularization (Lasso regression): Sets the weights of extreme data to 0.
- L2 regularization (Ridge regression): Brings the weights of extreme data close to 0.
- Easy explanation of regularization in machine learning - Qiita https://qiita.com/kenta1984/items/91ab29fae8cd3920cf2b
-
Dropout
- Learn by randomly deactivating nodes. Though the data is the same, different weights are applied each time because different data is learned each time.
-
Holdout Validation
- Split data at some ratio into training data and test data for validation.
-
K-fold Cross-Validation
-
Split the dataset into K parts, evaluate the combined results from learning with each part. Run patterns so that all data becomes validation data.
-
-
Ensemble Learning
- A machine learning technique that improves generalization ability by combining multiple learners trained independently.
- Bagging
- Generate multiple training datasets from all data using bootstrap method. Bootstrap method: randomly extract data from a population with replacement.
- Boosting
- Train the first model on training data and compare predictions with actual values. When training the next model, emphasize the incorrectly predicted data.
- Bagging
- A machine learning technique that improves generalization ability by combining multiple learners trained independently.
-
Supervised Learning
-
A method where learning data is labeled with correct answers.
-
Regression
-
Finding a line (function) representing the relationship between data for each data point.
-
Bayesian Linear Regression
- Bayesian probability: probability with personal subjective elements.
- Distribution differs based on confidence level.
- Bayesian linear regression uses Bayesian probability, treating high-confidence and low-confidence data (potentially noise) differently with different weights.
- Similar approach to L1, L2 regularization.
- Bayesian probability: probability with personal subjective elements.
-
Support Vector Regression (SVM)
-
A supervised learning pattern recognition model.
-
Support Vector
- The data points closest to the boundary.
-
Margin
- The distance between the support vectors and the boundary.
-
Support Vector Regression classifies based on margin maximization.
-
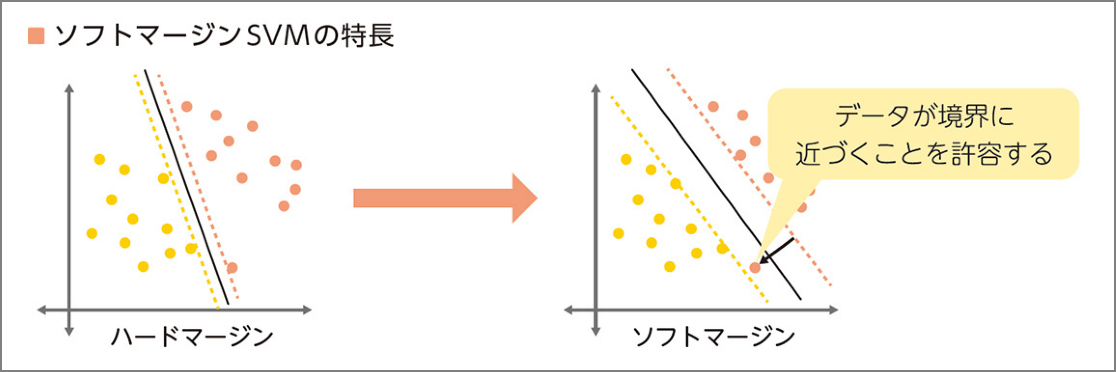
In the figure below, the diagonal line has a wider margin than the vertical line. This is called margin maximization.
-
Prevent overfitting by handling error (noise). Use the margin concept to create a dead zone (river width) for errors, making it less susceptible to noise.
-
Soft Margin SVM
-
Use data where allowing some error enables better linear separation (= don’t aim for perfect separation).
-
-
-
-
Random Forest
-
Decision tree-based algorithm.
-
Get output following these steps (ensemble learning):
- Create n datasets by random sampling (bagging) from data.
- Create each decision tree.
- Integrate the decision tree results.
-
-
-
Gradient Boosting
- Predict using a decision tree. Then find the difference between training set predictions and actual data to calculate error. Use this error as correct answer data for a second prediction using a decision tree.
-
k-Nearest Neighbors
- A supervised learning algorithm used for classification.
- Classify data by majority vote.
- A supervised learning algorithm used for classification.
-
Numerical Data Reshaping
- Discretization
- Divide continuous values into categories.
- Example: Divide visitor ages by age group.
- Divide continuous values into categories.
- Discretization
-
Classification
- Binary classification: e.g., classify as normal or abnormal.
- Logistic Regression
- Whether an email is spam, whether a transaction is fraudulent, etc.
- Predicts probability of occurrence and classifies as Yes/No based on probability.
- Logistic Regression
- Multi-class classification: classify into 3 or more categories.
- k-Nearest Neighbors
- Classify an unknown value as belonging to the nearest group.
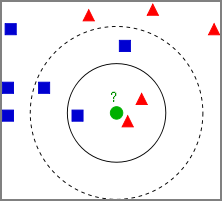
- Plot training data as vectors in space. When unknown data is obtained, get the nearest K points and estimate the class by majority vote.
- For the figure below, the classification flow is:
- Plot known data (training data) as yellow and purple circles.
- Decide K. e.g., K=3.
- When an unknown red star is obtained, get the nearest 3 points.
- Estimate the class by majority vote of those 3 classes. In this case, the unknown red star is estimated to belong to Class B.
- k-nearest neighbors algorithm - Wikipedia https://en.wikipedia.org/wiki/K-nearest_neighbors_algorithm
- k-Nearest Neighbors
- Binary classification: e.g., classify as normal or abnormal.
-
-
Representative Prediction Error Aggregation Methods in Regression Models
-
R² (Coefficient of Determination)
- An indicator obtained by normalizing prediction error. 0 means no prediction capability, 1 means perfect prediction; higher is better.
-
RMSE (Root Mean Square Error)
- An indicator that squares prediction errors, averages them, and then takes the root. Smaller is better.
-
MAE (Mean Absolute Error)
- An indicator that averages the absolute values of prediction errors.
-
-
Automated Hyperparameter Tuning
- Grid Search
- Try all combinations of hyperparameter candidates and select the best performing one. Becomes impractical as the number of combinations grows.
- Random Search
- Randomly try combinations of hyperparameters.
- Bayesian Optimization
- A method that uses a Gaussian process regression model to search for good hyperparameters. Calculate accuracy with some parameter candidates, then estimate more promising parameters based on those results for efficient search.
- Grid Search
-
Unsupervised Learning
- A method where learning data is not labeled.
- Clustering
-
Hierarchical Clustering
- A method that iteratively merges clusters with similar characteristics until all data forms one large cluster.
-
Non-hierarchical Clustering
- Set the number of clusters first, then cluster data to best separate it into that number of clusters.
-
Group similar data from various data.
-
k-Means
- Understanding k-means - Qiita https://qiita.com/g-k/items/0d5d22a12a4507ecbf11
-
Gaussian Distribution (Normal Distribution)
-
Dimensionality Reduction
- Dimension: the number of features.
- Dimensionality reduction: “reduce dimensions to the minimum necessary to achieve the objective (classification or regression).”
- Feature Selection
- Select only the most useful features from all possible features.
- Dimensionality Reduction
- Find and remove dimensions that can be removed without impact using Lasso regression, decision trees, etc.
- Principal Component Analysis (PCA)
- Synthesize new indicators that approximate the overall data distribution to reduce dimensions.
- t-SNE (t-distributed Stochastic Neighbor Embedding)
- A nonlinear dimensionality reduction method optimal for embedding high-dimensional data into 2D or 3D low-dimensional space for visualization.
- Feature Selection
-
-
Difference Between Classification and Clustering
-
Machine Learning Categories and Algorithms
-
Loss Function
-
In supervised machine learning, given a dataset (x, y), we learn so that the output of a function f(x; θ) with parameters θ approaches y. The loss function measures the difference between f’s output and the actual y.
-
Squared Error
-
Given a dataset (x, y) and regression model f, the loss function (squared error) is calculated as follows. Since it squares the difference between f(x) and y, the further apart they are, the larger the penalty. Strongly affected by outliers.
Absolute Error
-
Given a dataset (x, y) and regression model f, the loss function (absolute error) is calculated as follows. Since it doesn’t square the error, it grows more slowly than squared error.
-
-
-
-
Neural Networks
-
-
Backpropagation
-
In neural networks, feed the error between the model’s prediction and the actual correct value back through the network in reverse to update weights.
-
Issues
-
As the network gets deeper, errors don’t propagate all the way back.
-
The sigmoid function was used as an activation function, but its derivative has a maximum value of only 0.25. This means the propagating error gets smaller and smaller as we go back through hidden layers. The deeper the network, the less error is fed back (vanishing gradient problem).
-
-
-
-
-
Deep Learning Approaches
-
Pre-training Approach
-
Autoencoder
-
A network with two layers: visible and hidden. The visible layer is a combination of input and output layers.
-
The input and output layers produce the same result, as follows:
-
Output layer = Input layer > Hidden layer. Compressed information is transmitted to the hidden layer.
-
Input layer → hidden layer processing is encoding. Hidden layer → output layer is decoding.
-
-
Since autoencoders have input = output, they can’t output labels in this case — this is unsupervised learning. By stacking autoencoders and adding a logistic regression layer at the end (output layer using sigmoid or softmax function), it becomes supervised learning.
-
The logistic regression layer also needs weight adjustment (= fine-tuning).
-
Autoencoders consist of pre-training and fine-tuning stages.
-
-
-
Types of Neural Networks
- Convolutional Neural Network (CNN)
- Image recognition
- Recurrent Neural Network (RNN)
- Time series
- Suited for processing data that comes in sequentially over time with variable length.
- Convolutional Neural Network (CNN)
-
Iteration: Repeatedly going through all training data. Reduces training error.
- Batch Learning: Load all training data at once.
- Mini-batch Learning: Learn a specified number of data at a time.
- Online Learning: Load only one data point per learning step.
-
Hyperparameters
- Batch Size
- A method called mini-batch gradient descent is used, which is between batch gradient descent and stochastic gradient descent. The dataset is divided into several subsets.
- The number of data in each subset is the batch size.
- Number of Epochs
- Divide the dataset into N subsets according to batch size.
- Train on each subset. That is, repeat learning N times.
- Through this procedure, every data point in the dataset is used for training at least once. The number of epochs is the parameter for how many times to repeat.
- Learning Rate
- A hyperparameter that determines how much to change the weights in each layer at once.
- Batch Size
-
Algorithms
-
Linear Learner - Classification/Regression
-
Factorization Machines - Classification/Regression
-
XGBoost Algorithm - Classification/Regression
- XGBoost algorithm is used to solve regression, classification, and ranking problems.
- XGBoost uses regression trees as learners, builds and trains models through Boosting, and updates parameters using gradient information during training.
-
Image Classification Algorithm - Image classification
-
Object Detection Algorithm - Object detection
-
Sequence2Sequence - Machine translation, text summarization, speech recognition
-
K-Means Algorithm - Clustering
- Find groups in data where members within a group are similar to each other but different from members of other groups.
-
Principal Component Analysis (PCA) - Feature extraction
-
Latent Dirichlet Allocation (LDA) - Topic modeling
- A language model that probabilistically determines the “topic” of words in documents. Words don’t exist independently but have latent topics, and words with the same topic tend to appear in the same document.
-
Neural Topic Model (NTM) - Topic modeling
-
DeepAR Forecasting - Prediction for time series data
- Works best when trying to forecast using many similar time series across a set of cross-sectional units.
- Can be used to train a single model using all of many inputs and several time series.
-
ARIMA Model
- Train a model using a single time series.
-
BlazingText Word2Vec
-
Random Cut Forest - Anomaly detection
-
K-Nearest Neighbors - Classification/Regression
-
tf-idf
- Determines the importance of words in a document by weighting common and uncommon words within a document.
-
Bag-of-Words
- Tokenizes input document text and outputs a statistical description of the text.
-
IP Insights
-
Object2Vec
- “Object2Vec” is a method to “reduce high-dimensional vectors to lower dimensions while preserving as much information as possible, placing similar objects close together.” It is a general-purpose algorithm for “calculating relationships between things.”
-
Semantic Segmentation
-
-
Automatic Model Tuning
-
Confusion Matrix
- A matrix summarizing the results of class classification output from a binary classification problem. It’s an indicator for measuring the performance of binary classification machine learning models.
- What is a Confusion Matrix? About class classification for binary classification ML - Qiita https://qiita.com/TsutomuNakamura/items/a1a6a02cb9bb0dcbb37f
-
Evaluation Methods in Classification (TN, FN, TP, FP)
-
F1
- The F1 score (F score or F measure) is a measure of test accuracy.
Other
- Convert strings to integers for machine learning targets
- Ordinal encoding or one-hot encoding
- SageMaker automatic parameter tuning
- Usually, running one training job at a time gives the best results with the least computation time.
- Fraud detection algorithm
References and books:
Loss Functions | Methods for evaluating accuracy of machine learning algorithms https://axa.biopapyrus.jp/machine-learning/model-evaluation/loss-function.html
Deep Learning Textbook: Deep Learning G-Test (Generalist) Official Text | Shin-ichi Asakawa et al.
AI Basics Every Engineer Should Know | Hiroyuki Umeda